
Overview:
This post is about a project I finished earlier this year for a client that was about to embark on a very large environmental project in the oil and gas sector. Their client had some very specific reporting requirements that could not be met with standard Vision reports and working in spreadsheets to track data related to this job would be far too time consuming. The reports needed to allocate costs on any given invoice (current or historical) down to assets where the work was performed (in this case assets were wells but additional assets might also be added). To add further complexity, Project Management costs had to be spread to all assets where work was performed.
The client had already set up a project in Vision with over 250 Phases (WBS2) to identify specific locations where work could or would be performed (with some additional Phases for tracking Project Management work, sub-consultants, etc.). Additional locations (phases) would be added over time as work was to be performed there. Each location could represent a Well Pad or a Tank Battery and each location could have one or more Assets (Wells) associated to it. Staff working at a specific location would charge their time to that Phase of the project and invoices were produced with a breakout to the phase level.
The Problem:
The oil and gas client had a requirement to have a report produced that showed all of an invoice’s costs spread equally to each Asset (Well) that was associated to any location where work was performed and billed on said invoice. The allocation cost was calculated as:
Total Invoice $ for the location (WBS2) / Total No. of Wells at Location (WBS2) = Individual Well Cost
E.g. $1,000 (Charged to WBS2) / 10 Wells at Location (WBS2) = $100 cost per Well
Additionally, Project Management costs which are tracked on a separate phase for the project, must also be allocated to the Wells. Each Well associated to a location where work was performed will receive a portion of Project Management costs equal to the proportion that its costs are to the total invoice, less the Project Management amount. This was calculated as:
Total PM $ * Total Well $ / (Total Invoice $ – Total PM $) = PM $ Allocation to a Well
E.g. $1,000 (Total PM $) * $150 (Total Well $) / ($10,000 (Total Invoice $) – $1,000 (Total PM $)) = $16.67 PM Costs for the given Well
These calculations could have been built into a spreadsheet however, because the dollars are coming from Vision and because the associations of wells to locations is constantly changing, the manual effort required to maintain this would be daunting and likely to be very error prone.
The Solution:
The solution I implemented consisted of 3 main components:
- UDIC (User Defined Info Center) which would store all of the Asset records
- Custom Grid on a Custom Tab in the Project Info Center to track associations between Assets and the physical locations where they exist
- Custom SSRS (SQL Server Reporting Services) report
Additionally, Vision workflows and SQL Stored Procedures were required to tie everything together and to generate the database queries for the report.
AFTRS UDIC:
The UDIC is used to store information about each Well but is also able to track any other future assets. Each well can be tied to a specific project and associated to specific locations. Initially the client provided a master spreadsheet of the assets and these were bulk loaded into Vision using the Data Import tool to save time and reduce errors. Moving forward the client maintains the records manually by adding new assets, changing statuses and adjusting associations as required. Below is a screenshot of the AFTRS UDIC:
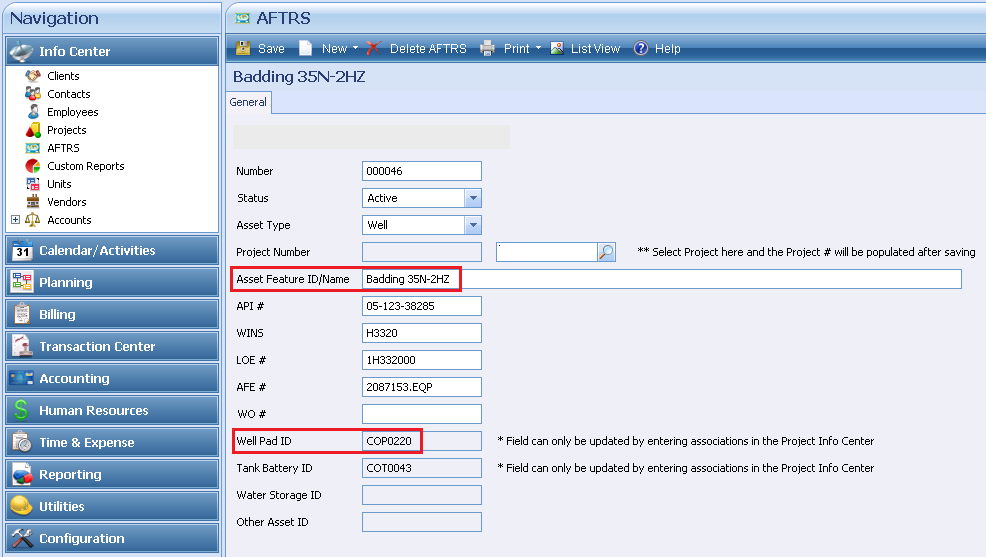
The red highlights show the Asset name and one of the locations it is associated to. The associations are made in the project info center record as shown in the next section and a workflow / stored procedure updates the AFTRS record.
Asset Associations:
In order to associate a well to a location, the users pick the asset from a lookup in a custom grid in a custom tab inside the project info center:
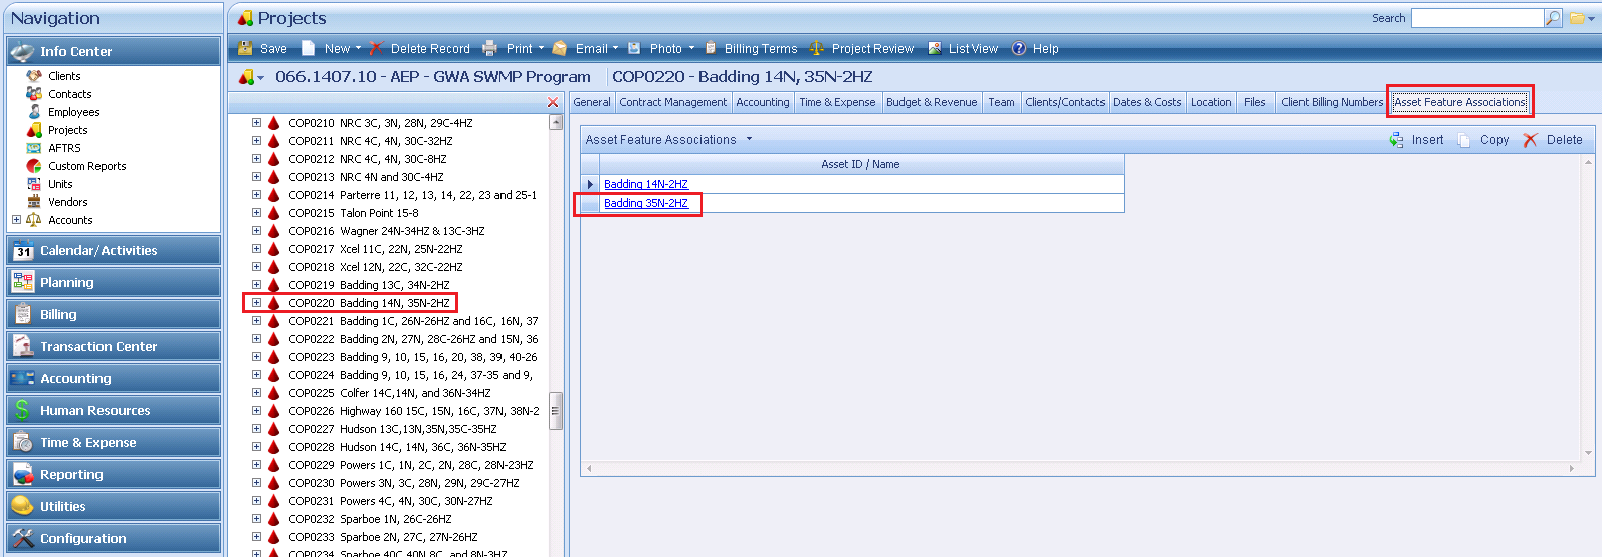
After selecting the Assets to associate to a location and saving the project record, the appropriate association field in the AFTRS UDIC is updated and a permanent tie between the asset and location is made.
To adjust the output of the report, the user can select the specific project and invoice to run against from drop downs in the report’s parameter selection area at the top of the screen. This allows the user to select an invoice, hit refresh to run the report, potentially print it, then move to another invoice without having to close the report:
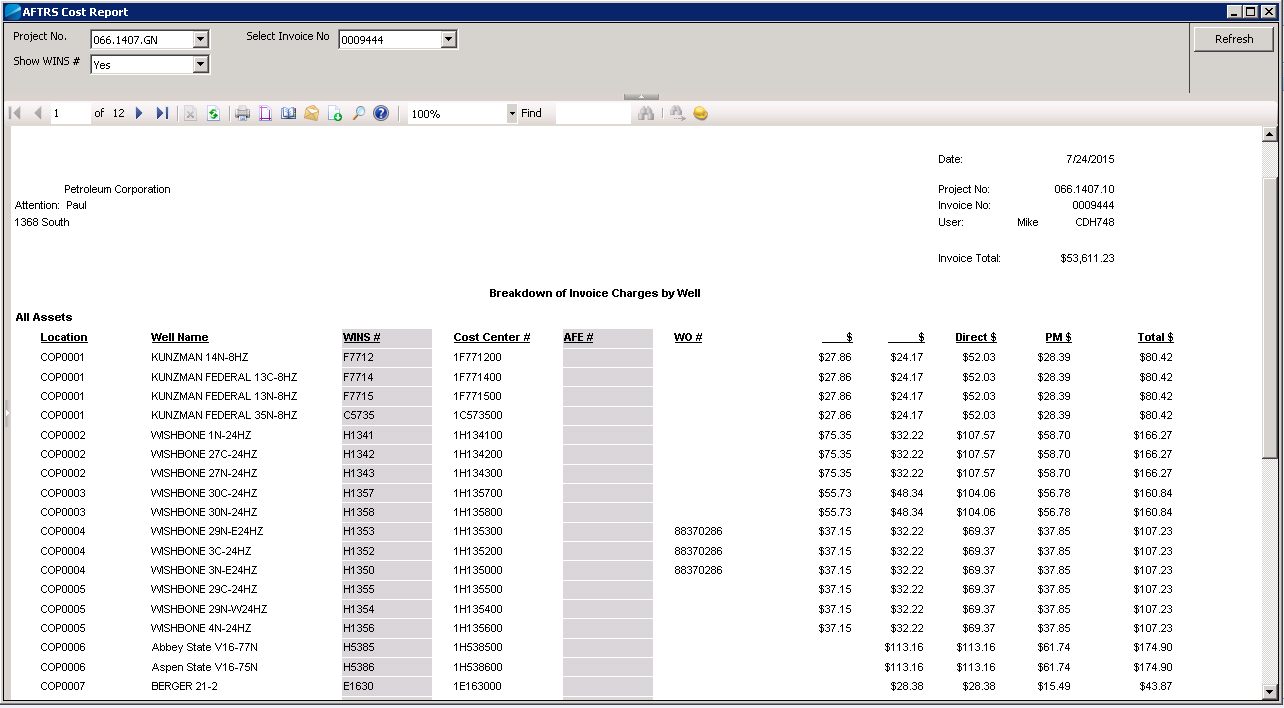
The report is grouped by location (WBS2) in the first column, then a listing of all Wells (Assets) at that location. The middle 4 columns list various information about the Well taken from the AFTRS UDIC. The dollar value columns represent from left to right:
- Internal Direct Costs
- Sub-Contractor Direct Costs
- Total Direct Costs
- Project Management Costs
- Total Cost to the Well

The second screen shot shows the totals at the end of the report. Total costs on the far right will match the total of the invoice.
Missing Associations Report:
Due to the large number of locations (250+) and Assets (1600+) and the continuous flow of changes coming from the client to where work is being performed, we discovered that the report was not always reconciling with the invoice totals. 99% of the time the cause was due to missed associations. To help quickly locate these omissions a second basic report was created. The report is run against any project/invoice where reconciliation is an issue and what it does is run a list of all active assets with associations and compare this to a list of the distinct Locations (WBS2) present on the invoice. If the invoice has Locations not in the list of Assets with associations, they are output to the report.
Any Location listed on the report meant that there should have been an association there and the person responsible for maintaining the data can quickly track the omission from the data they are provided with from the client:
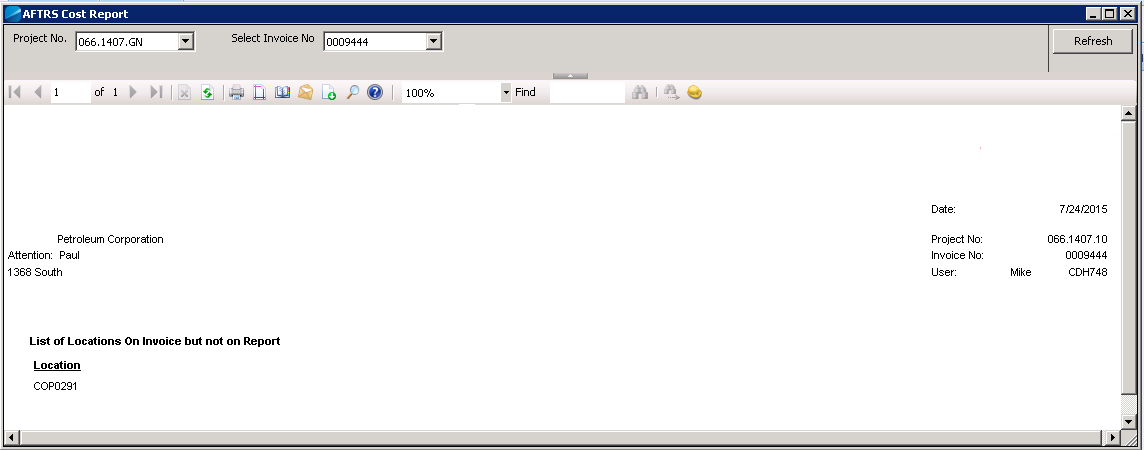
As you can see in the screenshot Location COP0291 had charges on the invoice but didn’t have any associations made to Assets.
Summary:
While the specific tracking and reporting requirements of this particular client may not be entirely relevant to everyone who reads this, the practical application of the tools used almost certainly are:
- Tracking unique information inside Vision using a UDIC
- Using workflows to manipulate data inside Vision
- Using Custom SSRS reports to extract information from Vision that would not be possible with standard reports
Perhaps your firm has a unique business problem that can be solved with some creative help from an experienced Deltek Vision consultant! Contact us if you would like a consultation: [email protected]